Marketing
How to Calculate Customer Acquisition Cost (CAC) for B2B SaaS: Formula, Worksheet and 2027 Benchmarks
Nikhil Adiga · · 7 min read
On this page
- What is the formula for customer acquisition cost?
- What goes into the cost side?
- How do you calculate CAC step by step?
- What does a worked CAC example look like?
- Is CAC ratio more useful than CAC per customer?
- How do you calculate CAC payback period?
- What is a good LTV to CAC ratio?
- Which mistakes inflate or hide your real CAC?
- How do you lower CAC without cutting pipeline?
- FAQ
Here's how to calculate customer acquisition cost: add up everything you spent on sales and marketing in a period, then divide by the number of new customers you won in that same period. CAC = total sales and marketing spend ÷ new customers acquired. The formula is easy. The hard part is deciding what goes into "spend," and that choice decides whether your CAC is something you can act on or just a number for a slide.
Most guides stop at the formula. This one includes a fill-in worksheet, a worked example for a seed-stage SaaS company, the two ratios investors actually ask about, and current benchmarks to check yourself against.
What is the formula for customer acquisition cost?
The standard formula is CAC = (marketing costs + sales costs) ÷ new customers acquired, with costs and customers measured over the same period. Most SaaS teams calculate it monthly and report it quarterly, because a single month's figure moves around too much when deals close in lumps.
There are three versions, and you should know which one you're quoting:
- Paid CAC: only paid media spend ÷ customers from paid channels. Good for judging channels, but it understates your real cost.
- Fully loaded CAC: all sales and marketing cost, including salaries, tools, agencies and overhead, ÷ all new customers. This is the honest number and the one investors expect.
- Blended CAC: fully loaded spend ÷ all new customers, inbound and outbound together. Use it for company-level efficiency and the paid or per-channel versions for allocation decisions.
What goes into the cost side?
Include every cost you would cut if you stopped acquiring customers tomorrow. That rule settles most arguments. Use this checklist:
| Cost line | Include? | Notes |
|---|---|---|
| Ad spend (search, social, sponsorships) | Yes | Use the spend for the period, not the invoices |
| Sales and marketing salaries, commission, benefits | Yes | Fully loaded, so add roughly 20–30% for payroll taxes and benefits |
| Founder time spent selling | Yes, estimated | Leaving this out is the most common way seed teams understate CAC |
| Sales and marketing software | Yes | CRM, data, sequencing, enrichment, analytics |
| Agencies, contractors, freelancers | Yes | Content, design, outbound and paid agencies |
| Events and travel for selling | Yes | Booth fees, travel to close deals |
| Customer success and onboarding | No | This is retention cost, which belongs in gross margin or net retention |
| Product and engineering | No | Unless an engineer works only on growth experiments |
How do you calculate CAC step by step?
Take one quarter, add up the costs from the checklist, count new paying logos, and divide. Here's the process in order:
- Pick the window. Use a quarter. If your sales cycle runs longer than 60 days, shift spend back one month, because this quarter's customers came from last quarter's pipeline.
- Pull spend from the general ledger, not from the ad dashboards. Dashboards miss salaries and tools.
- Count new customers only. Expansion, upsells and reactivated churned accounts don't count as new logos.
- Divide. Then do it again by channel, because one blended number hides which channel is losing money.
Fill-in CAC worksheet
| Line | Your quarter |
|---|---|
| A. Paid media | $______ |
| B. Sales and marketing payroll (fully loaded) | $______ |
| C. Estimated founder selling time | $______ |
| D. Sales and marketing tools | $______ |
| E. Agencies and contractors | $______ |
| F. Events and travel | $______ |
| G. Total spend (A–F) | $______ |
| H. New paying customers | ______ |
| CAC = G ÷ H | $______ |
| I. New ARR from those customers | $______ |
| CAC ratio = G ÷ I | $______ per $1 |
What does a worked CAC example look like?
Here's an illustrative seed-stage SaaS quarter, made up to show the arithmetic rather than taken from a real company. Suppose $30,000 in paid media, $90,000 in fully loaded payroll for one AE and one marketer, $25,000 of founder selling time, $9,000 in tools and $6,000 in contractors. That totals $160,000. The team closed 20 new customers at $12,000 ACV, which is $240,000 in new ARR.
- CAC = $160,000 ÷ 20 = $8,000 per customer
- CAC ratio = $160,000 ÷ $240,000 = $0.67 per $1 of new ARR
- Paid-only CAC = $30,000 ÷ 20 = $1,500. That's more than five times lower, and it's why "our CAC is $1,500" claims fall apart in diligence.
Is CAC ratio more useful than CAC per customer?
Yes, for comparing yourself to other companies, because the ratio adjusts for deal size. An $8,000 CAC looks fine on a $12,000 deal and terrible on a $3,000 one. The CAC ratio puts both on the same scale: dollars of sales and marketing spend per dollar of new ARR.
According to Benchmarkit's 2026 report on 2025 data, the median B2B SaaS company spent $1.63 in sales and marketing for every $1 of new-customer ARR, down from $2.00 in the Benchmarkit and Maxio 2025 report on 2024 data. The same 2026 report puts the median blended CAC ratio, which includes expansion ARR, at $1.30, down from $1.40.
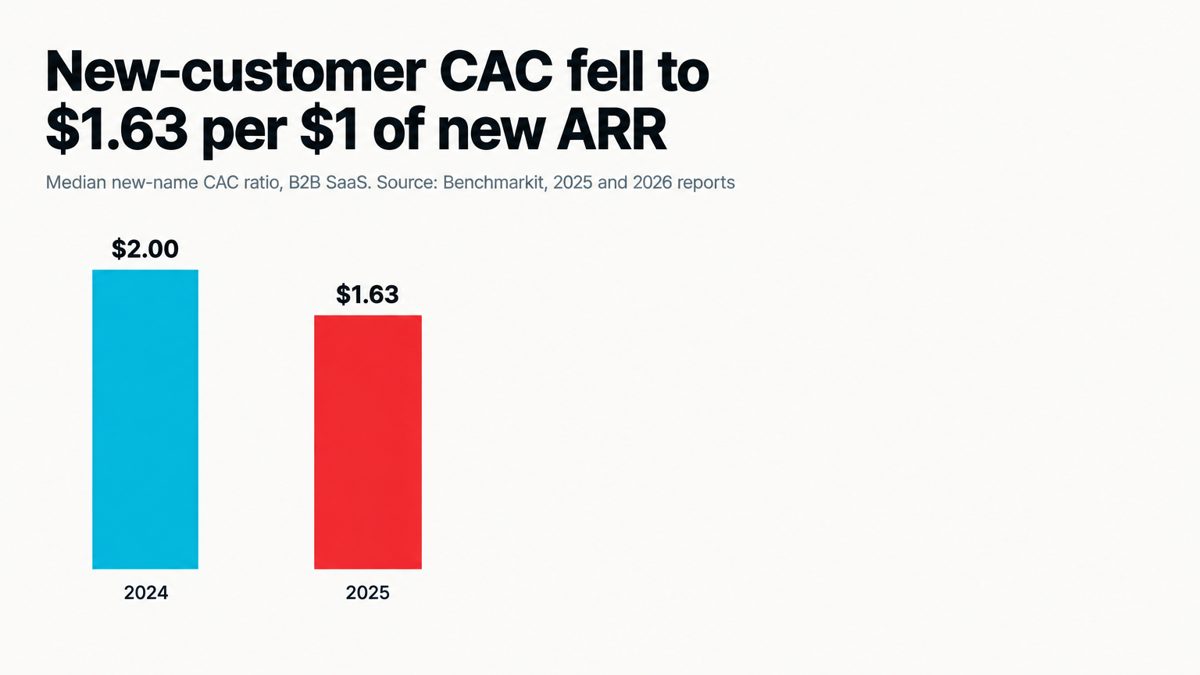
What to do with this: if your new-customer CAC ratio is above $2.00, find out which channel is pulling it up before you add budget anywhere.
How do you calculate CAC payback period?
CAC payback = CAC ÷ (monthly revenue per new customer × gross margin). It tells you how many months a customer takes to repay what you spent to win them. In the example above: $8,000 ÷ ($1,000 MRR × 80% margin) = 10 months.
Benchmarkit's 2026 report puts median CAC payback at 16 months for 2025, down from 18 months the year before. Deal size matters a lot. Companies with ACV under $5,000 had a median payback of 11 months, while the $50,000–$100,000 ACV band had a median of 22 months.
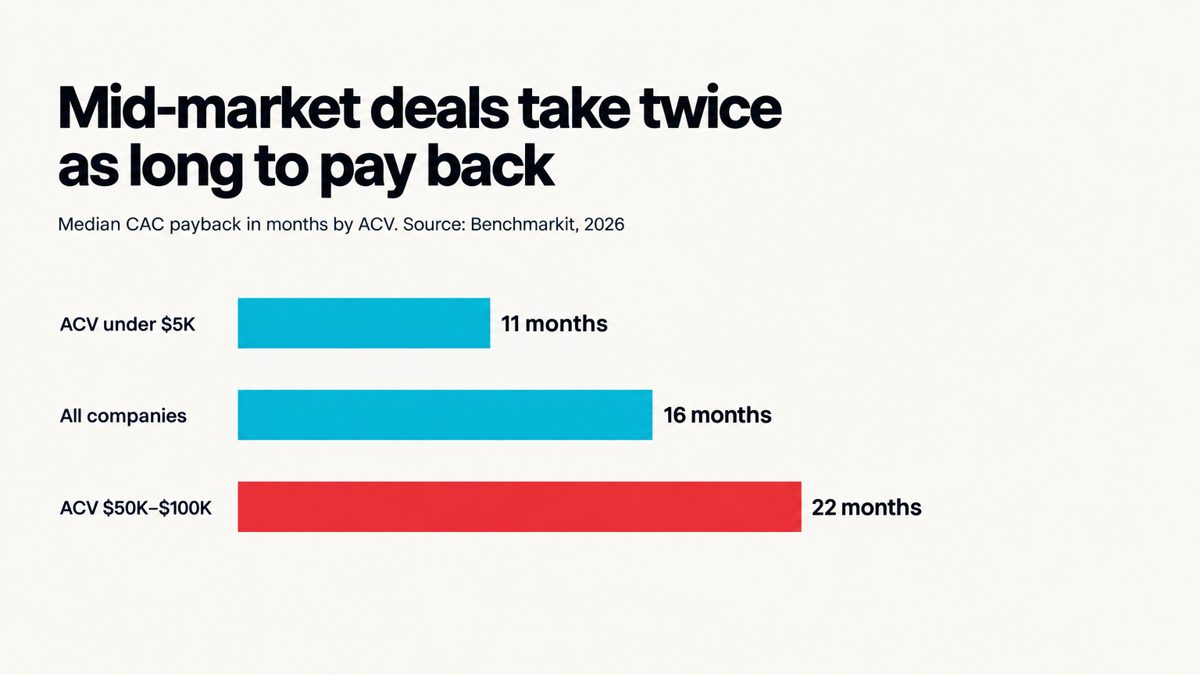
What to do with this: compare yourself to your own ACV band, not to the overall median. A 20-month payback is normal at $75,000 ACV and a warning sign at $4,000.
What is a good LTV to CAC ratio?
The usual planning rule is 3:1, meaning a customer is worth three times what it cost to win them. Benchmarkit's 2026 report found the 2025 median was higher, at 4.1x. If you're under 3x, you're paying too much to acquire customers or losing them too fast. If you're well above 5x, you're probably spending too little on growth.
Calculate LTV as (ARPA × gross margin) ÷ monthly churn rate. Early-stage companies should cap assumed customer lifetime at 3–5 years, because a 0.5% monthly churn rate from 18 months of data will produce an LTV nobody believes.
Which mistakes inflate or hide your real CAC?
These are the errors that come up again and again in founder forums and diligence calls:
- Leaving out founder time. If the CEO closes half the deals, CAC will jump as soon as you hire your first AE. Estimate it now.
- Counting expansion as new customers. This makes CAC look lower. Track new-logo CAC and blended CAC separately.
- Mismatched time windows. With a 90-day cycle, January's spend produces April's customers. Shift the spend window to match.
- Counting only the cheap channel. Referrals look free until you price in the time it took to build those relationships.
- One blended number. A healthy inbound CAC can hide outbound that's losing money. Always split by channel.
How do you lower CAC without cutting pipeline?
Most of the time, lowering CAC means shrinking the payroll part of spend per meeting booked, not cutting ad budgets. For most seed to Series B teams, the biggest cost lines are people doing repetitive prospecting: building lists, enriching contacts, writing first-touch emails and following up. Three moves bring CAC down quickly:
- Narrow the list. Fewer, better-fit accounts improve reply rates and cut bounced and wasted sends.
- Automate the top of the funnel. List building, enrichment and multi-channel first touches don't need a person on each step.
- Measure cost per booked meeting weekly. CAC lags by a quarter, but cost per meeting shows the trend within a few weeks.
That's the work 10ex is built for. Autonomous agents find buyers, verify their data across several sources, run outreach across channels and book the meetings, so the cost per meeting isn't tied to headcount. If your worksheet shows payroll as the biggest line, try 10ex and compare your cost per meeting after one quarter.
FAQ
What is the formula for customer acquisition cost?
CAC = total sales and marketing spend in a period ÷ new customers acquired in that period. Use fully loaded spend, including salaries, tools and founder selling time.
How do you calculate your CAC?
Pick a quarter, add up every sales and marketing cost from the general ledger, count only new paying logos, and divide. Then repeat by channel.
What is a good customer acquisition cost ratio?
Benchmarkit's 2026 report puts the 2025 median at $1.63 of spend per $1 of new-customer ARR. Coming in below that puts you ahead of the typical B2B SaaS company.
What is a good CLV to CAC ratio?
3:1 is the usual floor. Benchmarkit's 2026 report found a median of 4.1x for 2025.
Should I include customer success in CAC?
No. Customer success is a retention cost. Count it in gross margin or net revenue retention instead.
How often should I recalculate CAC?
Calculate it monthly and report it quarterly. Track cost per booked meeting weekly as the leading indicator.